
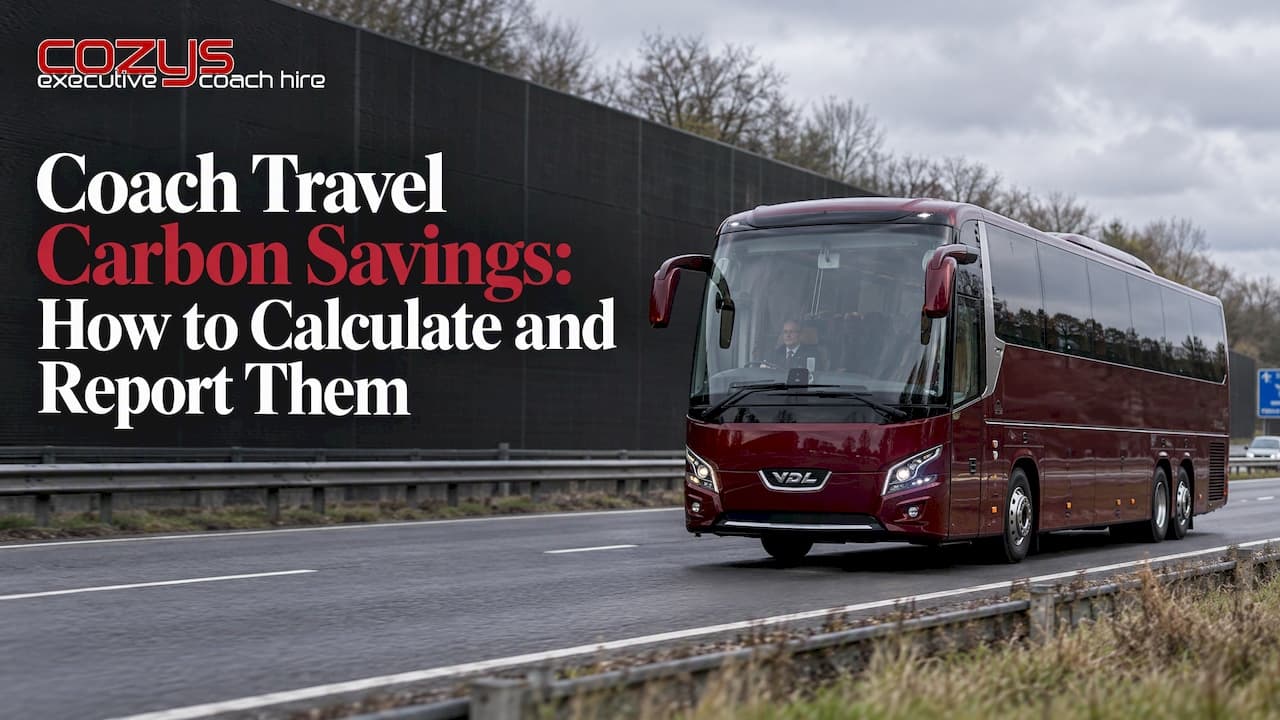
A full coach produces far less carbon per passenger than the same people travelling in separate cars, and you can put a figure on the difference. The 2026 UK government factor for coach is 0.03948 kg CO2e per passenger-kilometre, against 0.16152 kg CO2e per kilometre for an average petrol car, which usually carries only one or two people. This guide shows how to calculate the saving, which assumptions move the result, and how a UK organisation reports coach travel in its carbon accounts.
TL;DR
- Coaches cut emissions per passenger mainly because they carry many people on one vehicle. Occupancy is the biggest driver of the result.
- The 2026 UK government coach factor is 0.03948 kg CO2e per passenger-km. It rose 42 to 43% on 2025 because new operator data replaced figures that implied unrealistically high occupancy.
- The calculation is simple: passengers × distance in km × the official factor. Use the same method every year so the figures can be compared.
- Coach travel is business travel, normally reported as Scope 3 (category 6), and SECR sets the wider reporting duty for large UK companies.
- Hybrid coaches and good load planning lower the figure further than the published average.
Table of Contents
- What a coach saves compared with cars and planes
- The 2026 coach emission factor and why it changed
- How to calculate the carbon saving on a journey
- Reporting coach travel in UK business carbon accounts
- Where the savings are largest
- Our perspective
- Reducing the figure further
- Plan a lower-carbon group journey with us
- FAQ
- Sources
What a coach saves compared with cars and planes
Per passenger, a coach almost always emits less than a private car, because the emissions of one vehicle are shared across many seats. The UK government's transport and environment statistics reach the same conclusion: coaches carry more people per vehicle, so the footprint per head is lower than for private petrol or diesel cars.
The comparison depends on the assumptions behind it. The government's example journeys assume 1.6 people per car, economy passengers on flights and a petrol-car trip to the airport. Your own journey may differ by route and driver behaviour, so treat any published comparison as a representative case, not a guarantee.
For reference, the 2026 factors from the same published dataset, reproduced here, put the main modes in this range:
| Mode | 2026 factor | Unit |
|---|---|---|
| Coach | 0.03948 | kg CO2e per passenger-km |
| National rail | 0.03092 | kg CO2e per passenger-km |
| Short-haul flight, economy, with radiative forcing | 0.12576 | kg CO2e per passenger-km |
| Average petrol car | 0.16152 | kg CO2e per vehicle-km |
The car figure is per vehicle, not per person. At the 1.6 occupancy the government uses, one car comes to roughly 0.10 kg CO2e per passenger-km (0.16152 ÷ 1.6). A coach at the national average factor is therefore well under half of that, and a fuller coach does better still.
Rail is close to coach on the average factors. If you are weighing the two for a group, our guide to coach versus train questions for UK organisers covers the practical points beyond carbon: door-to-door access, luggage, step-free boarding and total cost.
For more on why shared road transport lowers the per-person footprint, these eco-friendly transport examples give further background.

The 2026 coach emission factor and why it changed
The government publishes greenhouse gas conversion factors every year so that organisations can report emissions from UK activity on a common basis. The 2026 set is designed for calculating and reporting emissions from activities in 2026. The factors are produced by DESNZ, and the next publication is due in June 2027.
The coach factor changed sharply this year. According to the government's major changes report, 2026 coach factors rose by 42 to 43% after new operator data replaced earlier data that implied unrealistically high occupancy. The methodology report adds that the update uses data from large coach operators to reflect actual occupancy better.

If you compare your 2026 figures with last year's, read the rise as a change in method and data. It is not a sign that coaches suddenly got dirtier. Note the change in your reporting commentary so your board or procurement team does not misread it.
The factor is an average across the national coach fleet and typical loads. A modern coach on a well-filled charter can come in below it. A half-empty one will come in above it.
How to calculate the carbon saving on a journey
The government's guidance is to use distance-based methods for travel, applying the official coach factor when you do not have fuel consumption data for the vehicle. Here is the process.
- Record the passengers and the distance. Use the actual headcount and the route distance in kilometres, outward and return.
- Calculate the coach emissions. Passengers × kilometres × 0.03948 kg CO2e.
- Calculate the alternative. For cars, divide passengers by the average occupancy you assume (1.6 is the government's example), multiply by the number of cars and the distance, then apply the car factor per kilometre.
- Subtract. The difference is the saving. Record the assumptions alongside it.
Worked example
A company moves 50 colleagues to a conference 200 km away, one way.
- Coach: 50 × 200 × 0.03948 = 394.8 kg CO2e.
- Cars: 50 ÷ 1.6 = about 31 cars. 31.25 cars × 200 km × 0.16152 = about 1,009 kg CO2e.
- Saving: roughly 615 kg CO2e, or around 61% lower for the coach.
This example is conservative for the coach. The factor reflects average national occupancy, and 50 people is a near-full 53-seat vehicle. Our own journeys on full loads would normally sit below the average, but for reporting you should use the official factor unless you hold vehicle-specific fuel data.
Which factors move the answer
- Occupancy. A higher load factor means lower emissions per passenger-km. This is the single biggest lever, so book the right size of vehicle for the group. A 16-seat minibus for 14 people is often better than a 49-seat coach for 14.
- Distance. Over very short trips, a standing start and urban stop-start driving weigh more heavily. Over longer motorway runs, the per-passenger figure tends to be steadier.
- Vehicle type. Hybrid and newer engines use less fuel for the same work. Our comparison of coach fuel types sets out how the main options differ.
- Empty running. If a coach drops a group and returns empty, the emissions of the return leg still count against the job. Ask operators how they plan the positioning legs.
Reporting coach travel in UK business carbon accounts
For most organisations, hired coach travel is a purchased service. Business travel in vehicles you do not own or control is generally reported as Scope 3, category 6, which the 2026 factors treat as business travel. The government methodology describes this as "other indirect emissions" in its methodology report.
What SECR requires
Under Streamlined Energy and Carbon Reporting, large unquoted companies and LLPs must report their UK energy use, including transport, and the associated greenhouse gas emissions. The government's sustainability reporting guidance sets out the detail. Check the current guidance and your own legal or finance team to confirm whether you fall inside the threshold and which transport categories are mandatory for you.
A January 2026 evaluation of SECR found the framework has raised awareness of carbon accounting at board level, even where reporting of specific Scope 3 categories remains voluntary. Many organisations therefore report coach travel anyway, because clients, funders and tender documents ask for it.
Practical reporting habits
- Keep a trip log: date, route, kilometres, passenger numbers and vehicle size.
- State the year of the factor you used (2026) and the unit (kg CO2e per passenger-km).
- Apply one method consistently, and note when the factor changed, as it did this year.
- Ask your coach operator for trip records and, where available, fuel data. Fuel data lets you replace the average factor with a vehicle-specific figure.
For a wider framework, our guide to sustainable travel policy and Scope 3 explains how avoiding, reducing and shifting trips fits with reporting. For tenders that need measurable targets, see procurement-ready KPIs for sustainable group travel.
Where the savings are largest
The carbon case is strongest where many people make the same journey at the same time.
- Home-to-school routes. One vehicle replaces a long line of parent car trips at the same hour. Local authorities and schools can count the reduction in car journeys as well as the emissions.
- Staff and event travel. Conferences, site visits and away days move a whole team on one vehicle.
- Tours and community outings. Groups travelling together by coach avoid dozens of separate trips, and accessible vehicles keep everyone in the same group.
- Regular contract work. Repeated runs let you plan loads and measure trends year on year. Our note on contract coach services replacing up to 50 cars describes how this works in practice.
One group example from the research helps frame scale: a 50-passenger coach can replace as many as 28 cars on the road, according to a parliamentary evidence submission, though the real figure depends on how many people each car would otherwise carry.
Our perspective
Carbon savings from coach travel are real, but they are earned by good planning as much as by the vehicle. The official factor is an average. The organisations that beat it are the ones that match vehicle size to group size, plan routes sensibly and keep records.
We have run group transport for over four decades, and our fleet runs from 16 to 85 seats for exactly that reason: the right size of vehicle for the group keeps load factors high. We also run the UK's first hybrid coach, built to lower fuel use on the same journey, and our fleet holds the highest 6-star BUSK safety rating, because a lower-carbon journey should also be a safe one.
Our advice to procurement and travel managers is to ask for trip data, report it with the current government factor, and treat the figure as something to improve each year. For school and corporate contracts, we work with clients to provide the records they need.
Cozys
Reducing the figure further
Once you have a baseline, there are four reliable ways to bring it down.
- Right-size the vehicle. Fill seats. Split or combine groups where timetables allow.
- Choose a lower-emission vehicle. Our hybrid coach hire is built for groups that want a lower fuel burn on the same route.
- Plan the route. Fewer empty positioning miles and steady motorway running help.
- Consider overnight options. For long distances, the trade-offs between hotel nights and overnight running are covered in our guide to overnight coach travel.
Cost and carbon often move together, since less fuel burned means lower fuel spend. For the money side, see coach cost per mile in the UK.
Plan a lower-carbon group journey with us
We provide coach and minibus hire for organisations, from 16 to 85 seats, including coach hire for corporate groups, tour operators and community organisations. For employers, our corporate transport service covers staff travel and events, and our schools and colleges service covers trips and regular routes. Tell us your group size, route and reporting needs, and we will recommend a vehicle that fits.
For home-to-school contracts, local authorities and private schools can start from our home-to-school transport page. For wheelchair users in the group, our accessible specialists can arrange suitable vehicles.
FAQ
How much carbon does coach travel save compared with driving?
The saving depends on how many people would otherwise share each car. At the government's example of 1.6 people per car, a car comes to roughly 0.10 kg CO2e per passenger-km, against 0.03948 for a coach at the 2026 average factor. For a 50-person journey of 200 km that is about 615 kg CO2e, or around 61% lower, before any benefit from a fuller or hybrid coach.
What is the UK coach emission factor for 2026?
The 2026 factor is 0.03948 kg CO2e per passenger-km, reported under Scope 3 business travel. It is 42 to 43% higher than 2025 because the government replaced earlier data with operator data that better reflects real occupancy. Check the official conversion factors page for the current workbook.
Do I have to report coach travel emissions?
Under SECR, large unquoted companies and LLPs must report UK energy use, including transport, and associated emissions. Reporting of specific Scope 3 categories can be voluntary, but many clients and tenders ask for it. Confirm your own obligations with your finance or legal adviser.
Can I use my own fuel data instead of the national factor?
Yes. The government guidance says to apply the official coach factor when vehicle fuel consumption data is unavailable, which means fuel data is preferred when you have it. Ask your operator for trip or fuel records, and keep the method the same each year.
Sources
- Transport and environment statistics 2022
- 2026 Government greenhouse gas conversion factors: methodology report
- 2026 Government greenhouse gas conversion factors: major changes report
- Greenhouse gas reporting: conversion factors 2026
- Sustainability reporting guidance 2023-24
- Evaluation of Streamlined Energy and Carbon Reporting
- UK DEFRA emission factors 2026 dataset
Recommended
- Sustainable Group Travel: Procurement Ready KPIs for UK Organisers
- UK Sustainable Travel Policy Links Avoid Reduce Shift With Scope 3
- Coach vs train: 6 questions UK organisers must ask before booking
This article is produced as general information only and is not professional advise.